Description
BioViz is an R package, which includes a number of visualization functions for the day-to-day work in biomarker identification. These include general visualizations (i.e. Scatter-, Line-, Densityplots and Histograms), but also more specific ones for modeling or time series.
Be aware however that this package is still under heavy development and the code as well as the interfaces will change frequently. Neither has this package been published on CRAN and therefore has not yet undergone any quality control other than my own common sense.
Installation
The easiest way to get BioViz is to install it via devtools:
devtools::install.github("jhooge/BioViz")Usage
The functions are encapsuled in their respective modules, depending on their category of usage.
general: Includes all general plots like scatterplots, barplots, histograms, but also correlation plots dimred: Includes all plots regarding dimensionality reduction techniques (e.g. PCA, MCA, t-SNE, …) timeseries: All plots regarding timeseries analyses clustering: All plots regarding the visualization of clusters (dendrograms, heatmaps, ellipse plots)
After you have loaded the library you can access each of the functions, by accessing the category first and then call a specific function from this category.
For example:
library(BioViz)
general.corplot(data=mtcars, cor.type="pearson",
                disp.sig.lev=0.05, group.cut=4,
                conf.level=0.95, cex=0.95, add.hist=TRUE)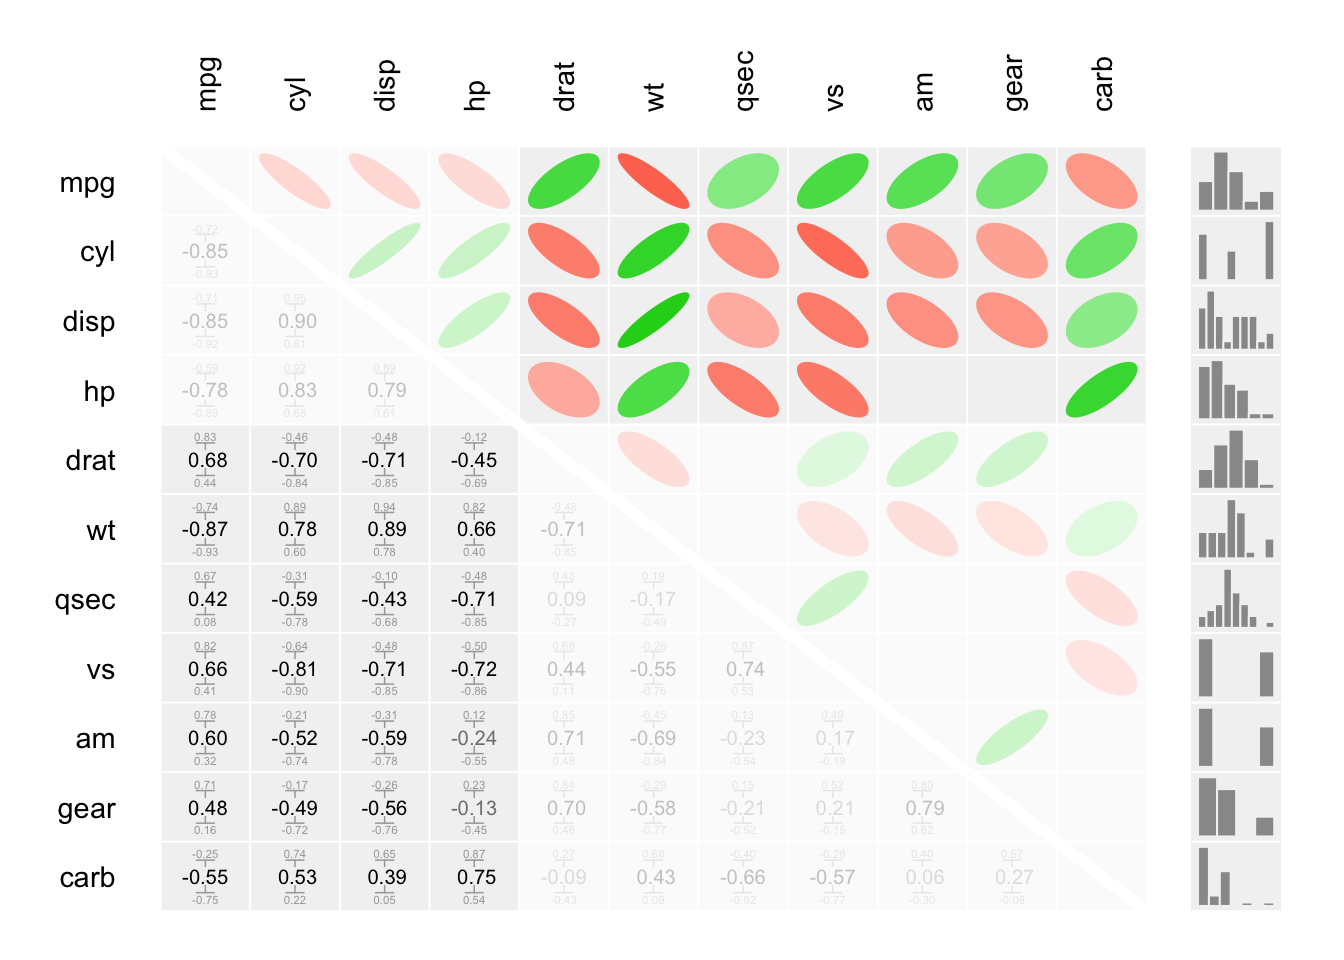
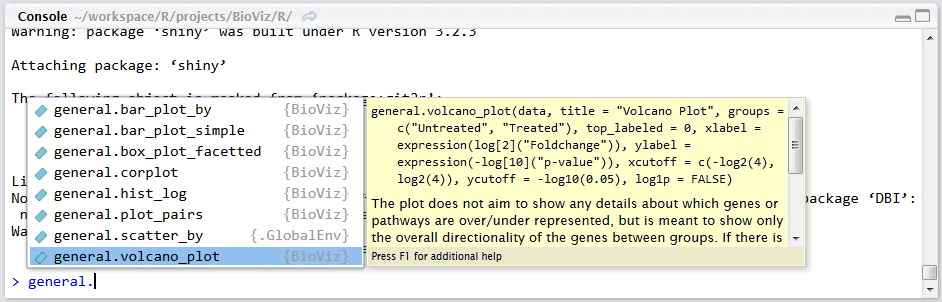
If you are using an IDE (like RStudio), which provides code completion, this way of accessing is highly convenient. By typing the function category and a “.” the respective IDE will show each of the functions available within this category.