Definition
A scatter plot (also called a scatter graph, scatter chart, scattergram, or scatter diagram) is a type of plot or mathematical diagram using Cartesian coordinates to display values for typically two variables for a set of data. If the points are color-coded, one additional variable can be displayed. The data is displayed as a collection of points, each having the value of one variable determining the position on the horizontal axis and the value of the other variable determining the position on the vertical axis.
library(BioViz)
n <- 500
x <- rnorm(n)
y <- rnorm(n)+x^2
df <- data.frame(x=x, y=y,
                 A=sample(c("a1", "a2"), n, replace = TRUE),
                 B=sample(c("b1", "b2"), n, replace = TRUE))
A simple ungrouped scatter plot with a loess fit
general.scatter(df)
## `geom_smooth()` using method = 'loess'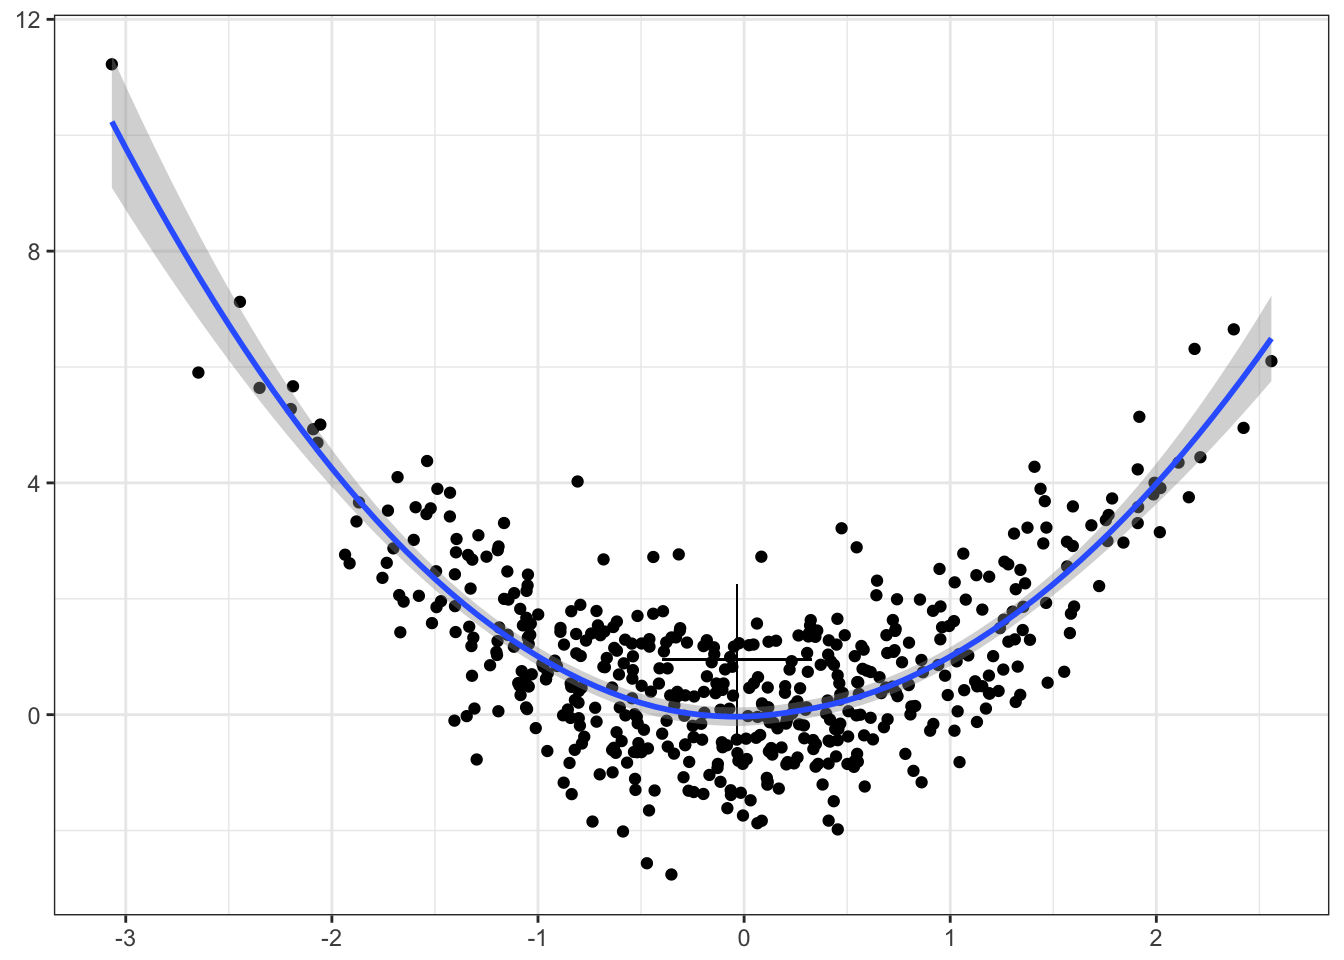
A grouped scatter plot with a loess fit
general.scatter(df, by="A")
## `geom_smooth()` using method = 'loess'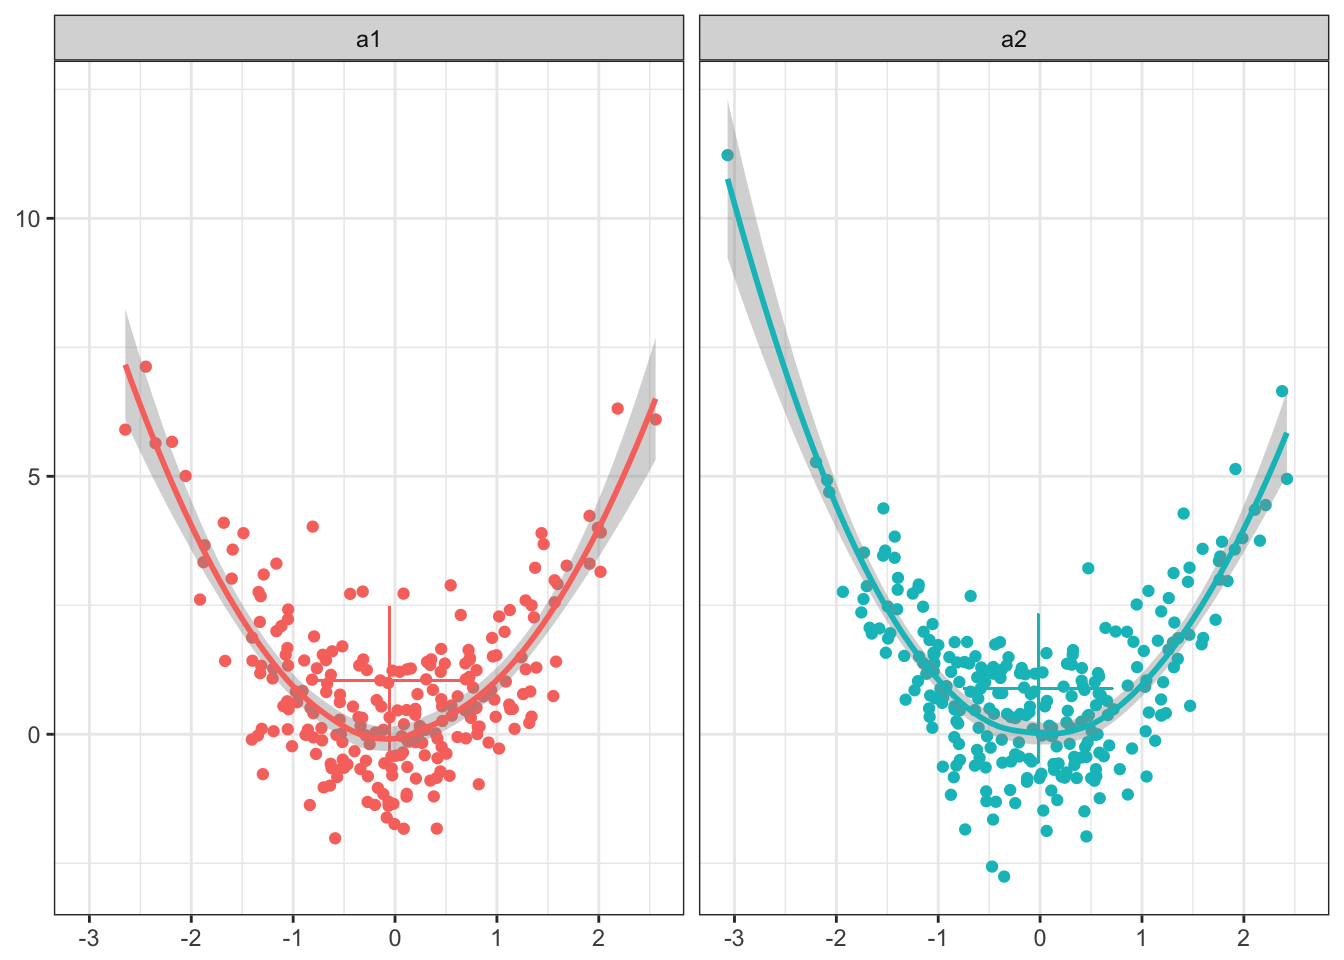
An ungrouped scatter plot and a marker indicating the data variance
general.scatter(df, fun="var")
## `geom_smooth()` using method = 'loess'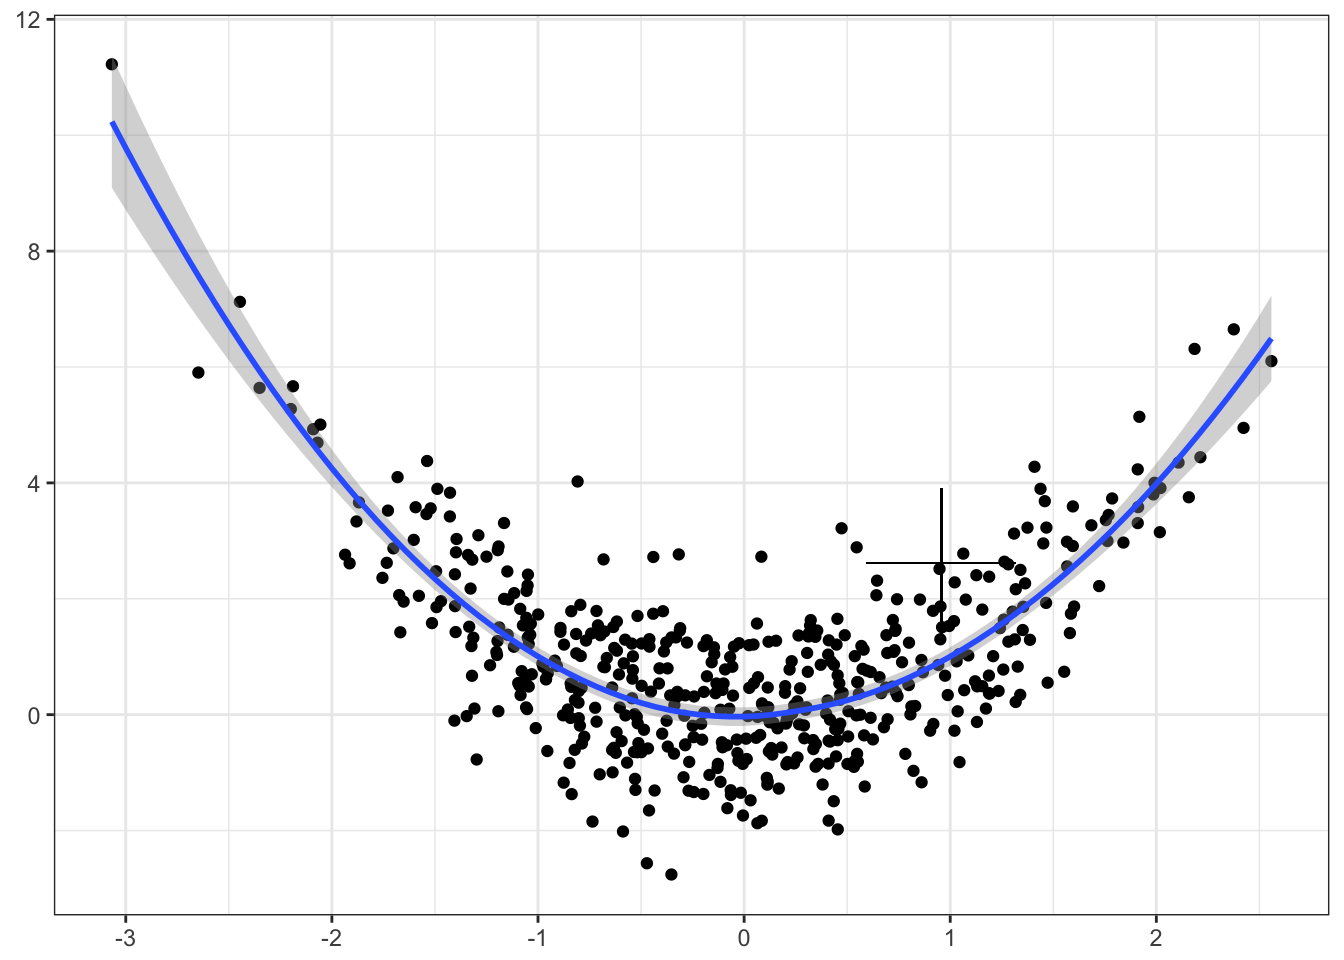
Scatterplots with different regression fits
Linear Fit
general.scatter(df, by="A", smooth.fun="lm")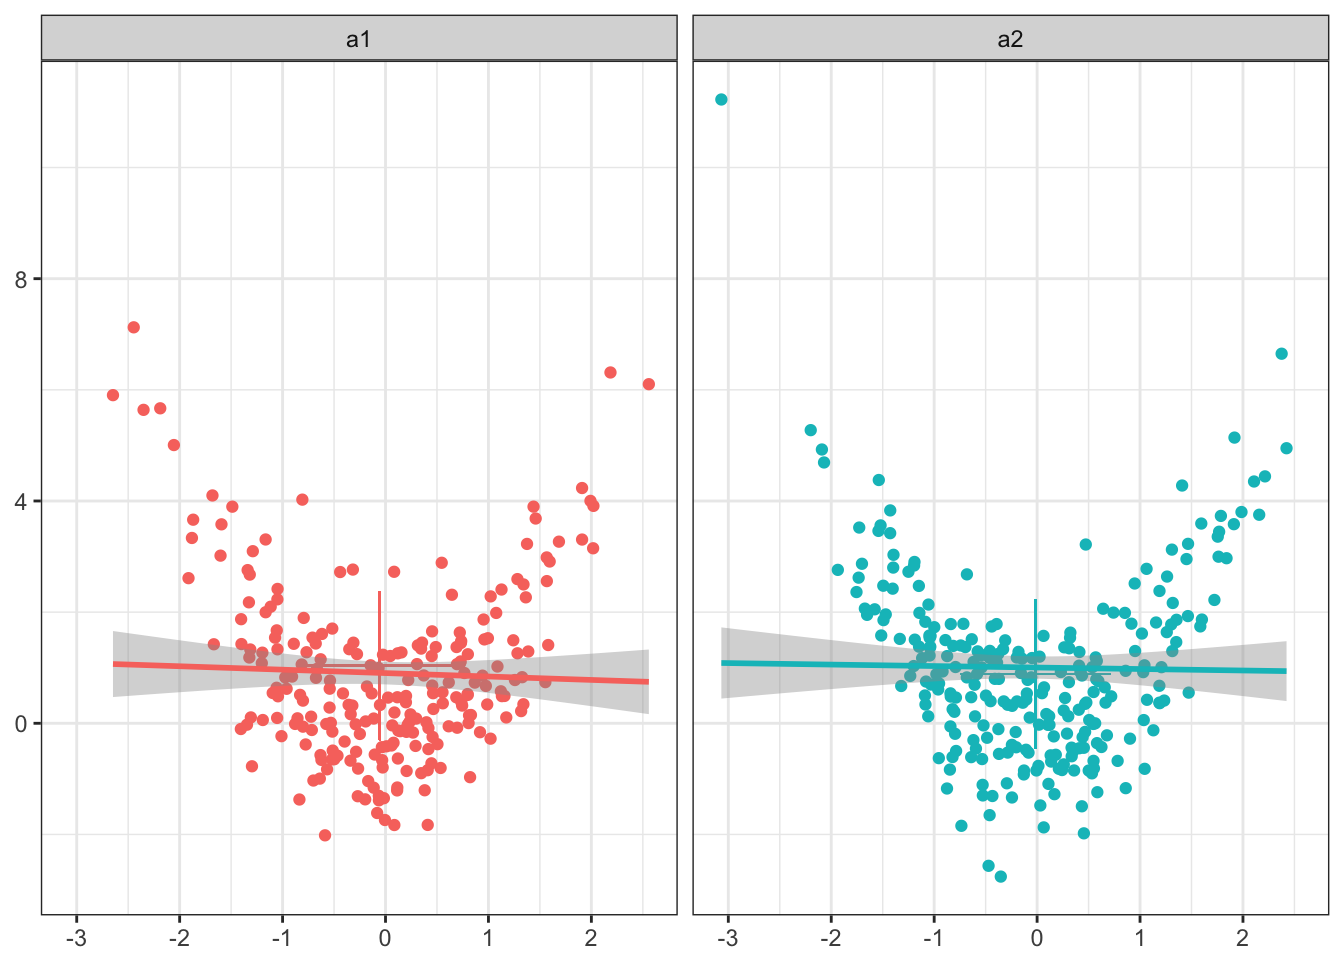
Robust Linear Fit
library(MASS)
general.scatter(df, by="A", smooth.fun="rlm")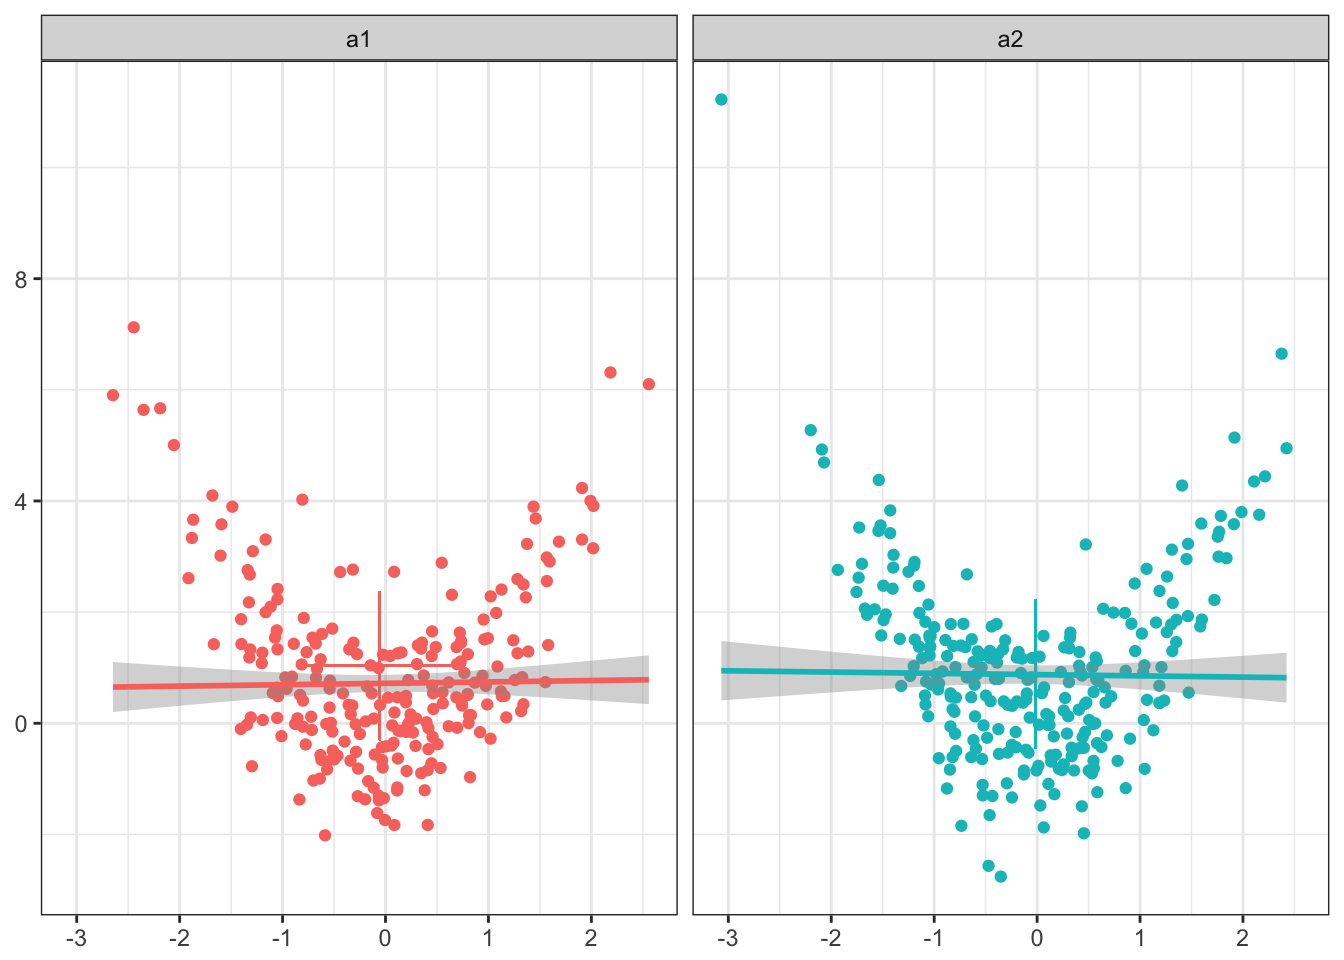
User defined polynomial fit
Degree = 1 resulting in a linear fit
general.scatter(df, smooth.fun="glm", smooth.formula=y ~ poly(x, 1)) 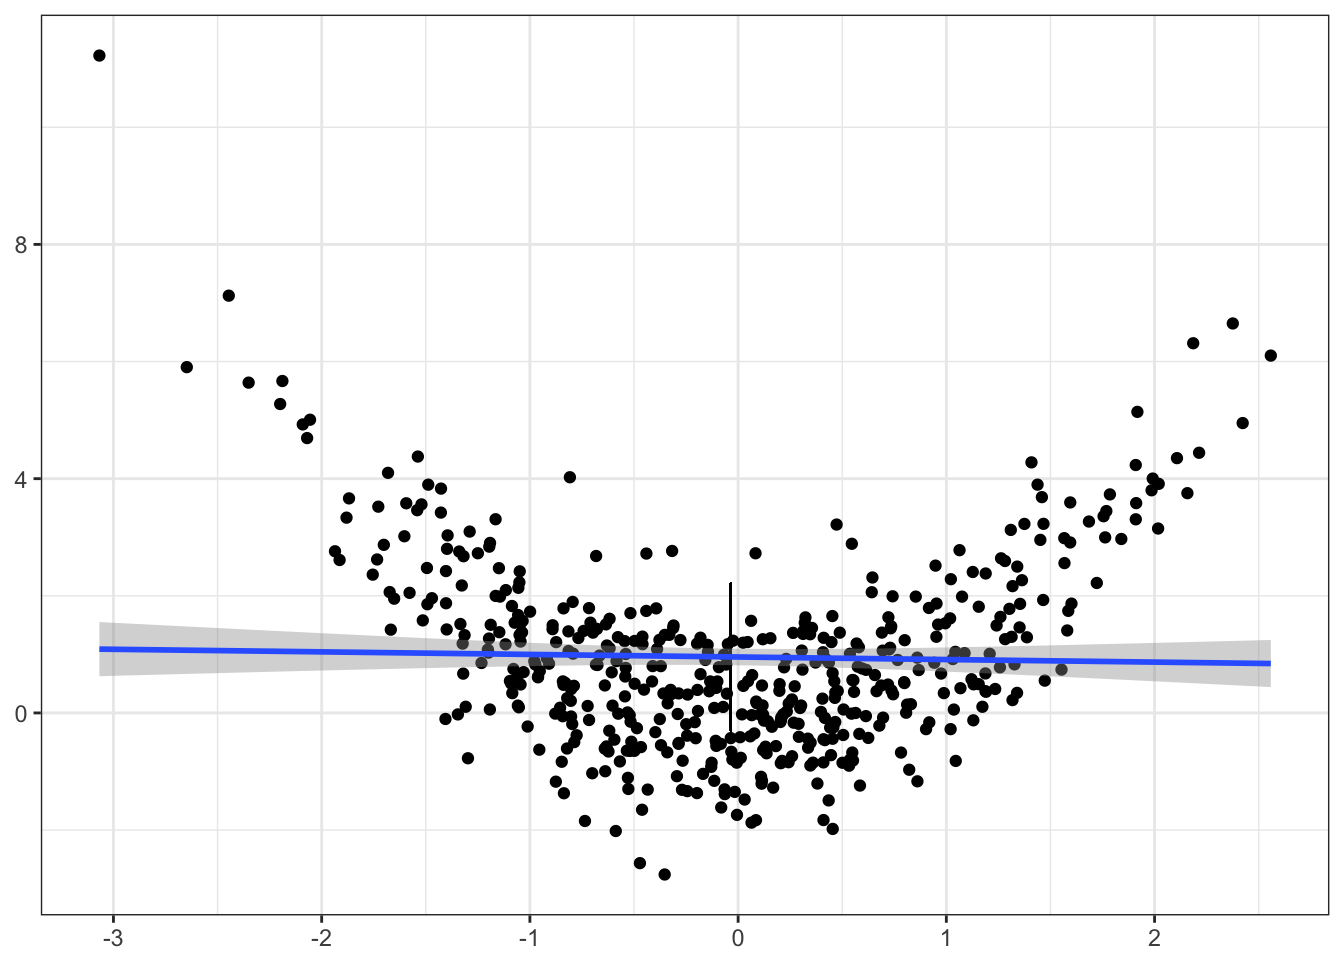
Degree = 2 resulting in a quadratic fit
general.scatter(df, smooth.fun="glm", smooth.formula=y ~ poly(x, 2))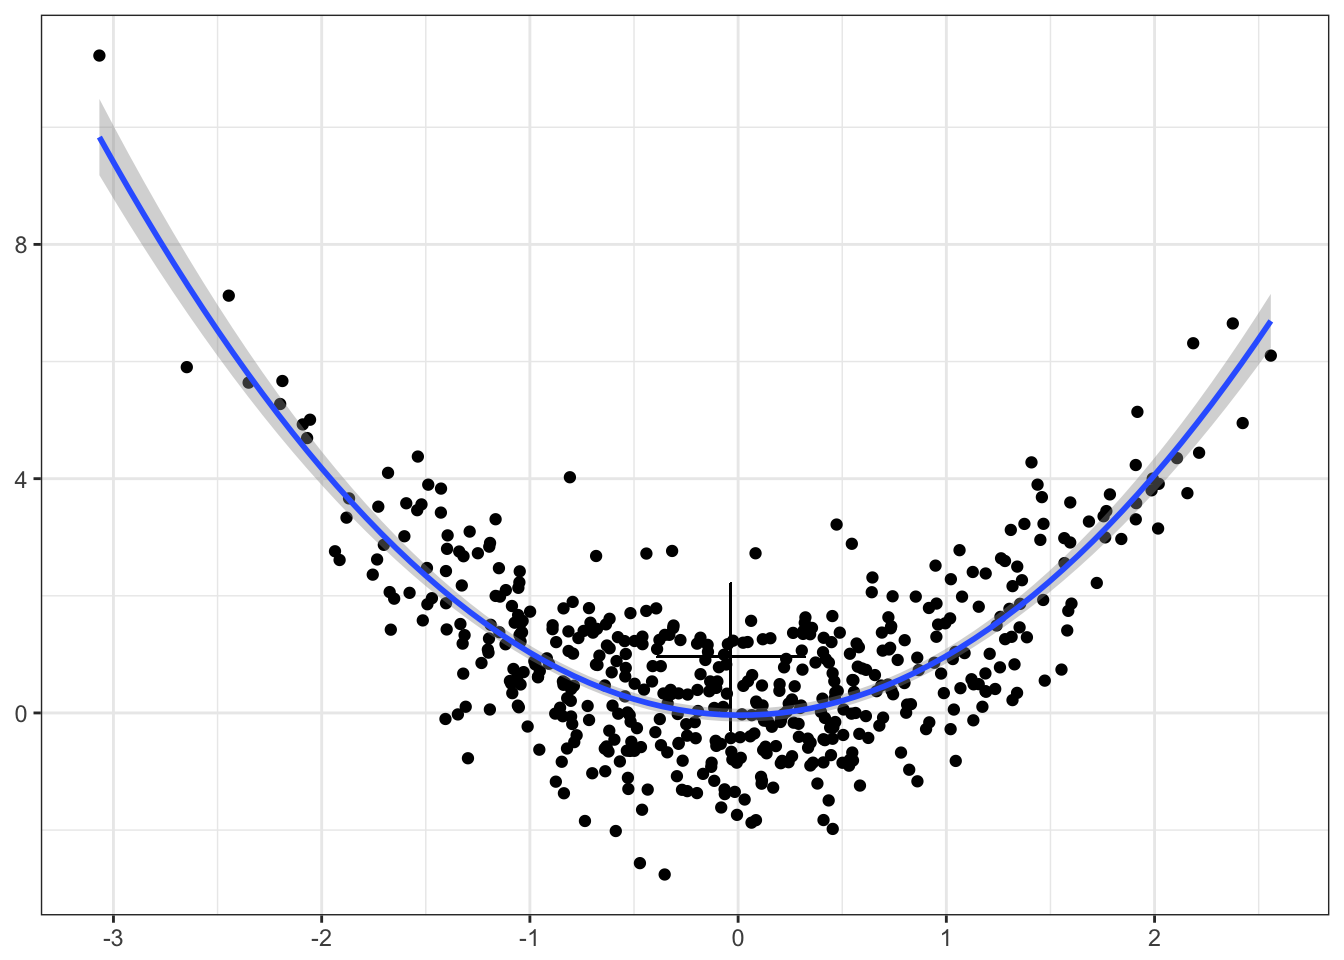
Equivalently for grouped scatterplots
Degree = 1 resulting in a linear fit
general.scatter(df, by="A", smooth.fun="glm", smooth.formula=y ~ poly(x, 1))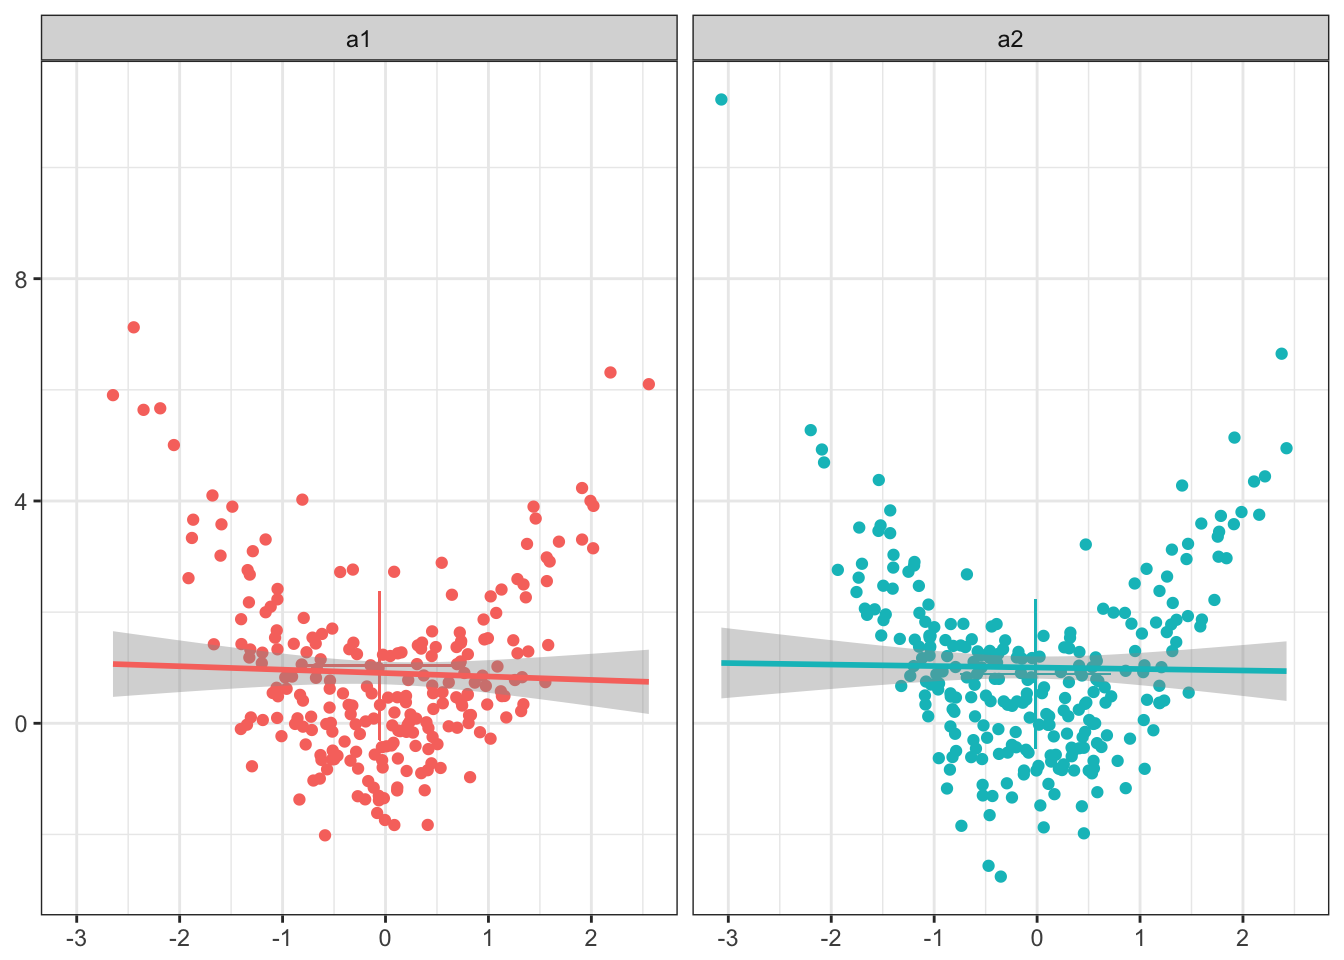
Degree = 2 resulting in a quadratic fit
general.scatter(df, by="B", smooth.fun="glm", smooth.formula=y ~ poly(x, 2))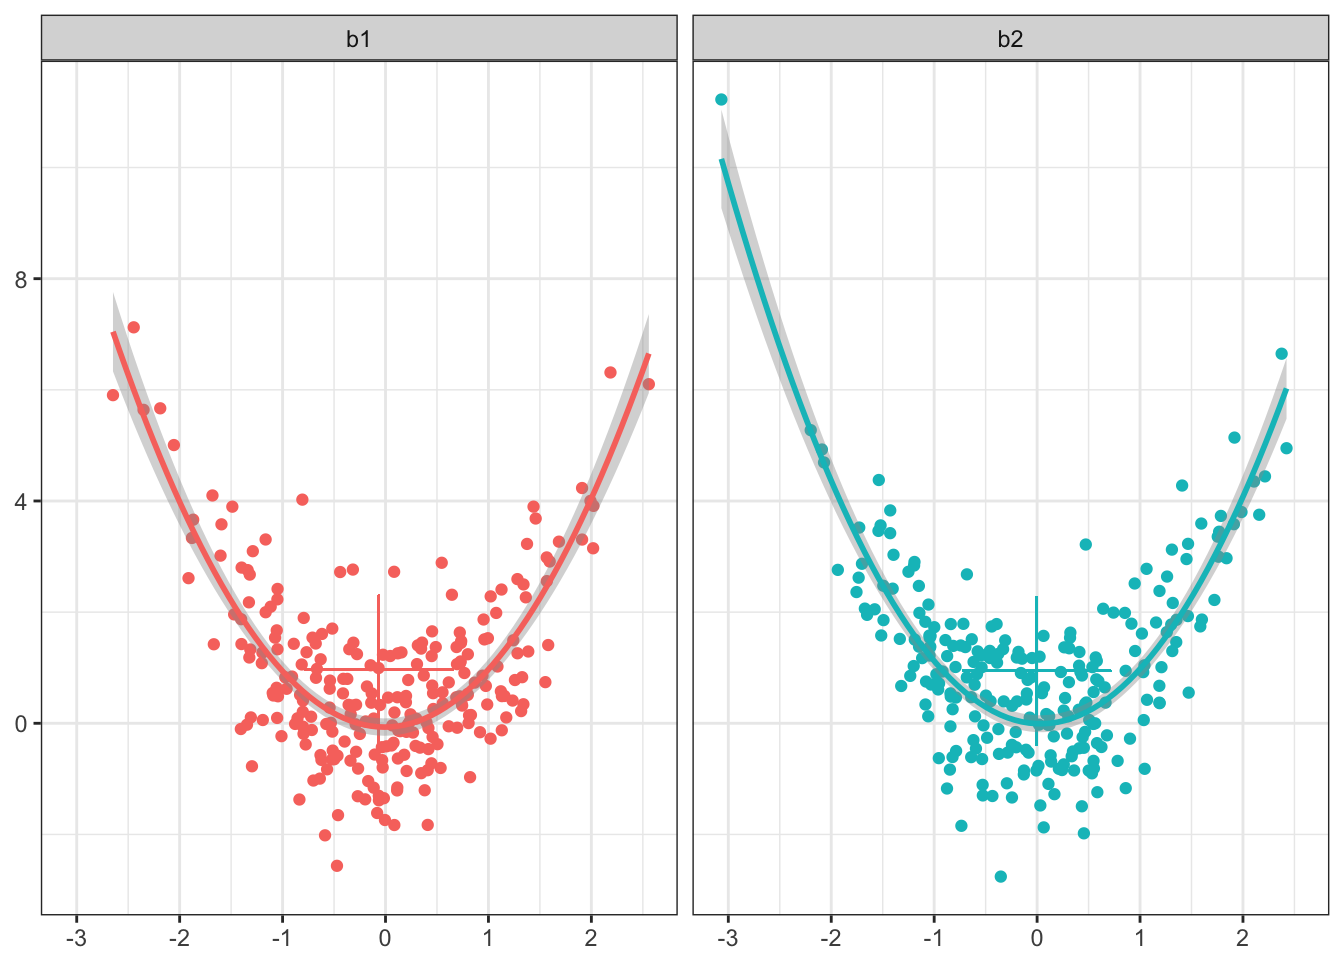
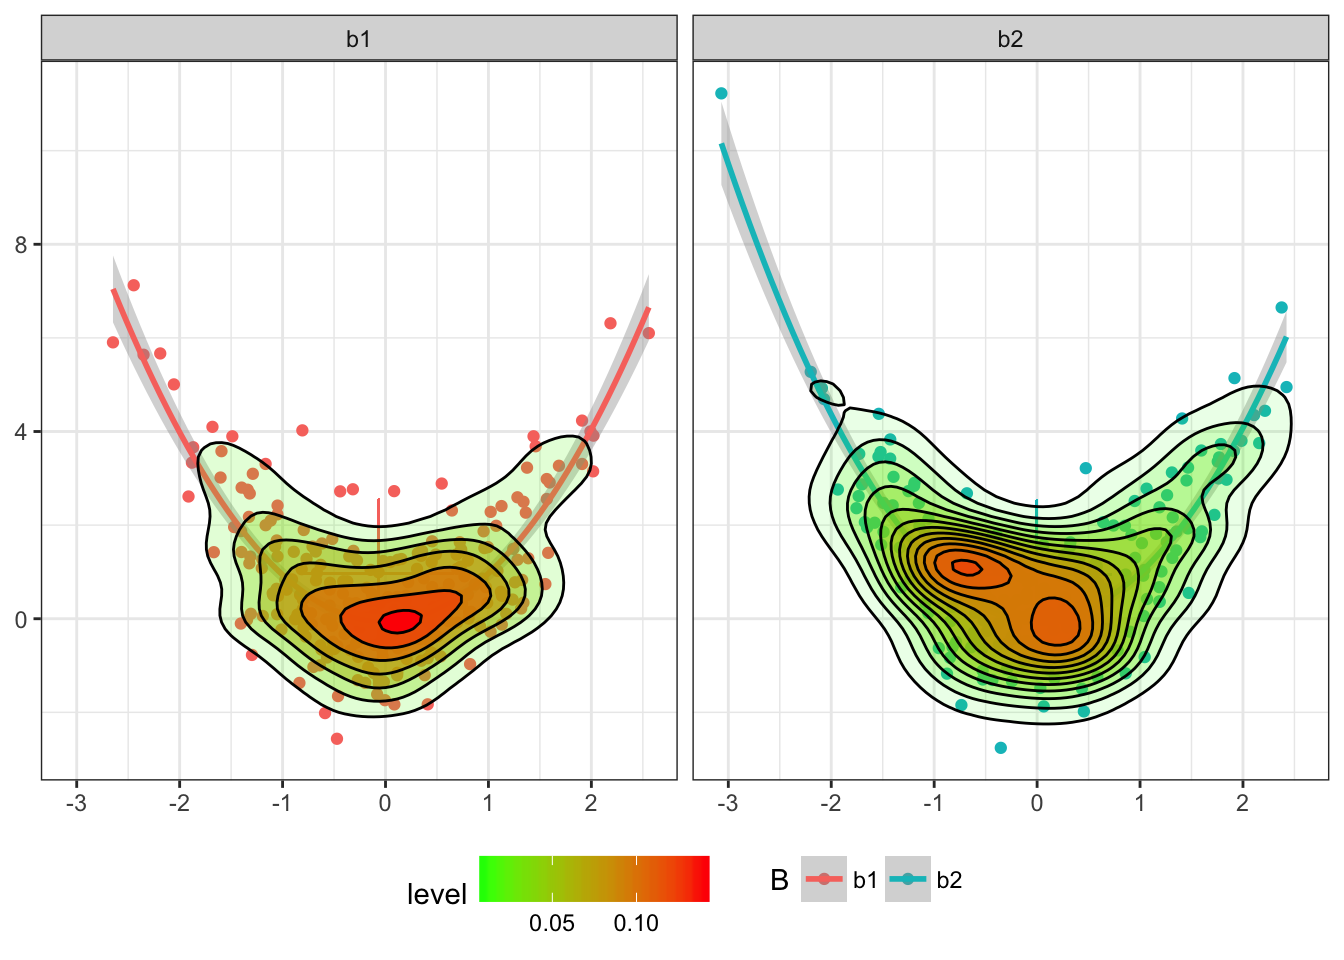
Including a density contour
general.scatter(df, by="B", smooth.fun="glm", smooth.formula=y ~ poly(x, 2),
                density=T, legend.pos="bottom")