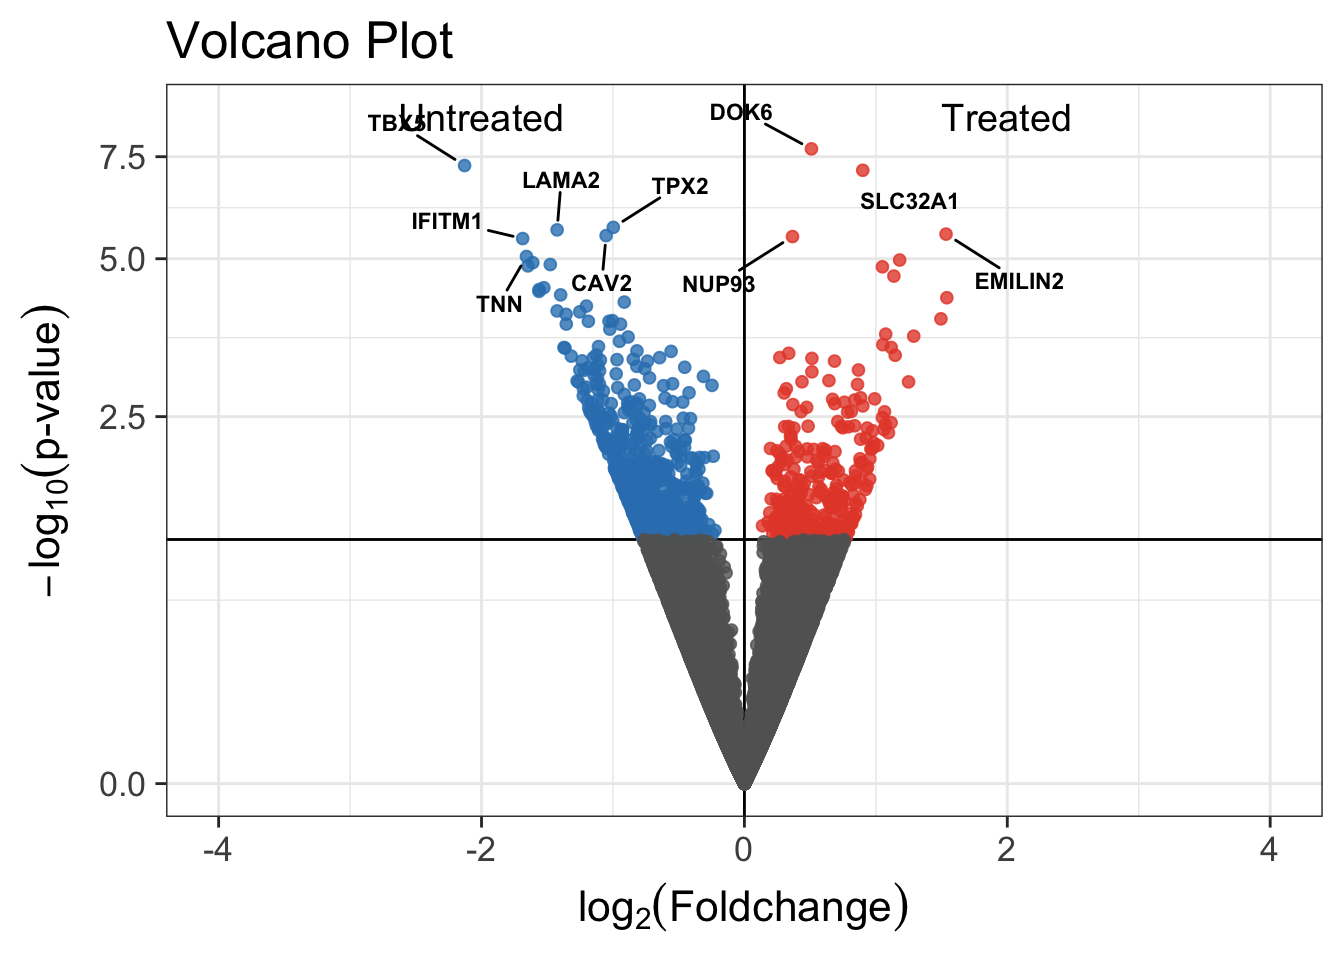
Volcano Plot
A volcano plot is a type of scatter-plot that is used to quickly identify changes in large data sets composed of replicate data. It plots significance versus fold-change on the y and x axes, respectively. These plots are increasingly common in omic experiments such as genomics, proteomics, and metabolomics where one often has a list of many thousands of replicate data points between two conditions and one wishes to quickly identify the most meaningful changes. A volcano plot combines a measure of statistical significance from a statistical test (e.g., a p value from an ANOVA model) with the magnitude of the change, enabling quick visual identification of those data-points (genes, etc.) that display large magnitude changes that are also statistically significant.
Simple
library(BioViz)
data(iPSC)
general.volcano_plot(iPSC)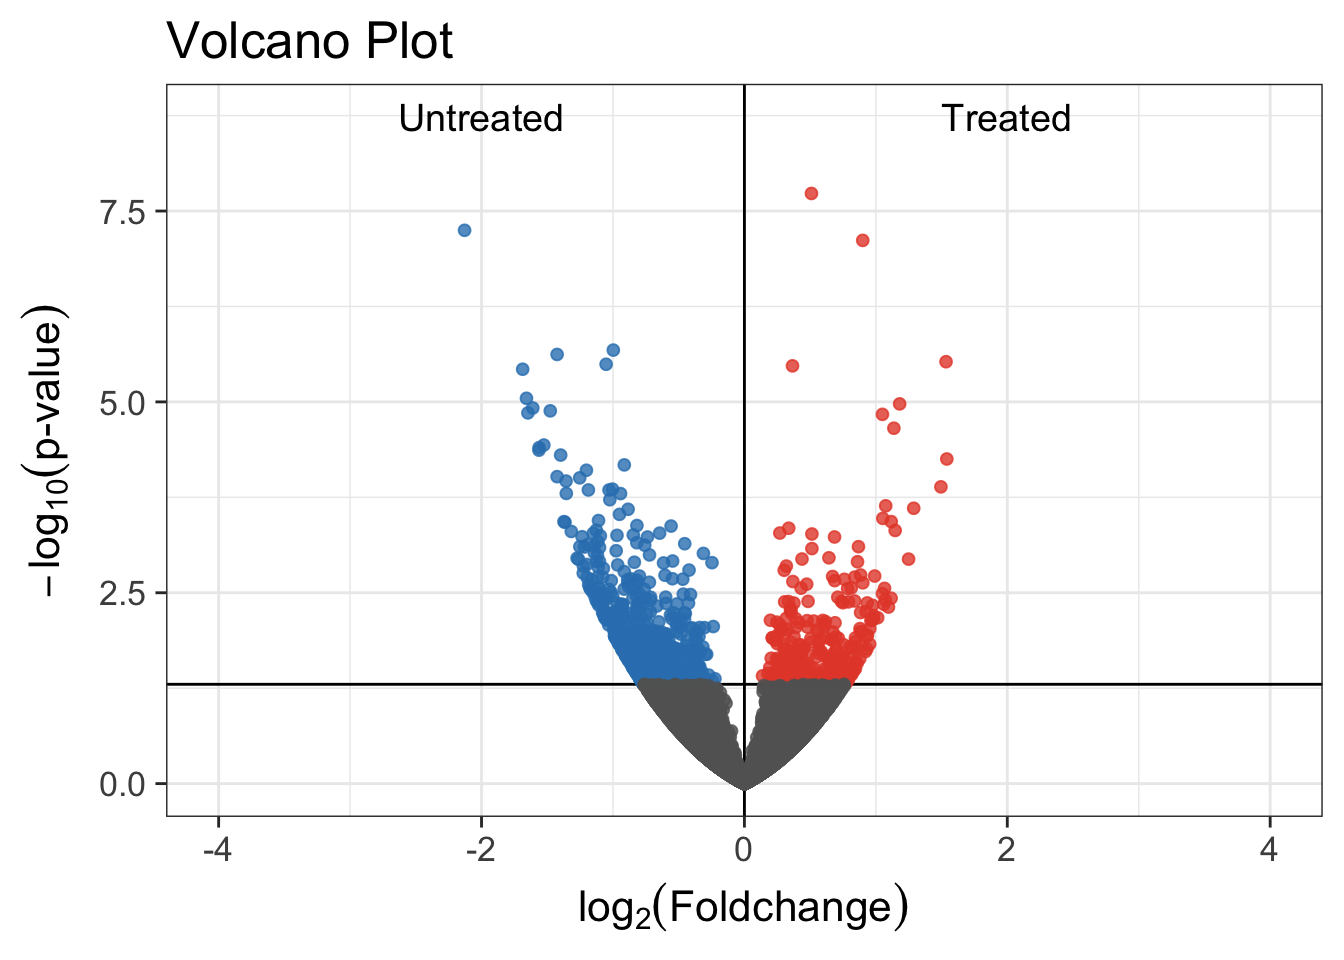
Volcano Plot with Group Labels
general.volcano_plot(iPSC, groups=c("A", "B"))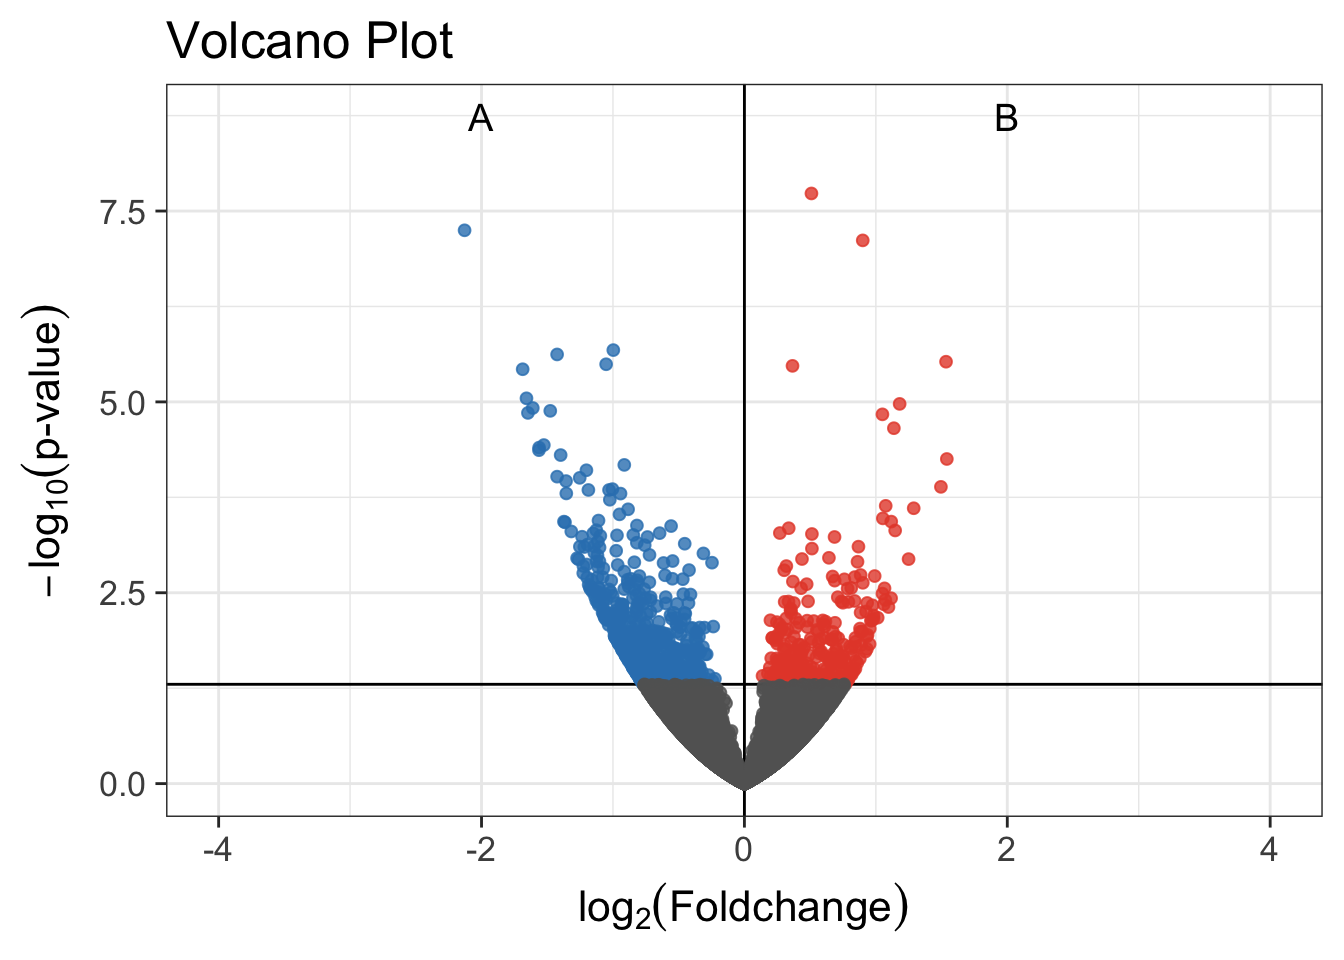
Volcano Plot annotated by top10 most significant samples
general.volcano_plot(iPSC, top_labeled=10, xcutoff=c(-log2(2), log2(4)))
## Selecting by pvalue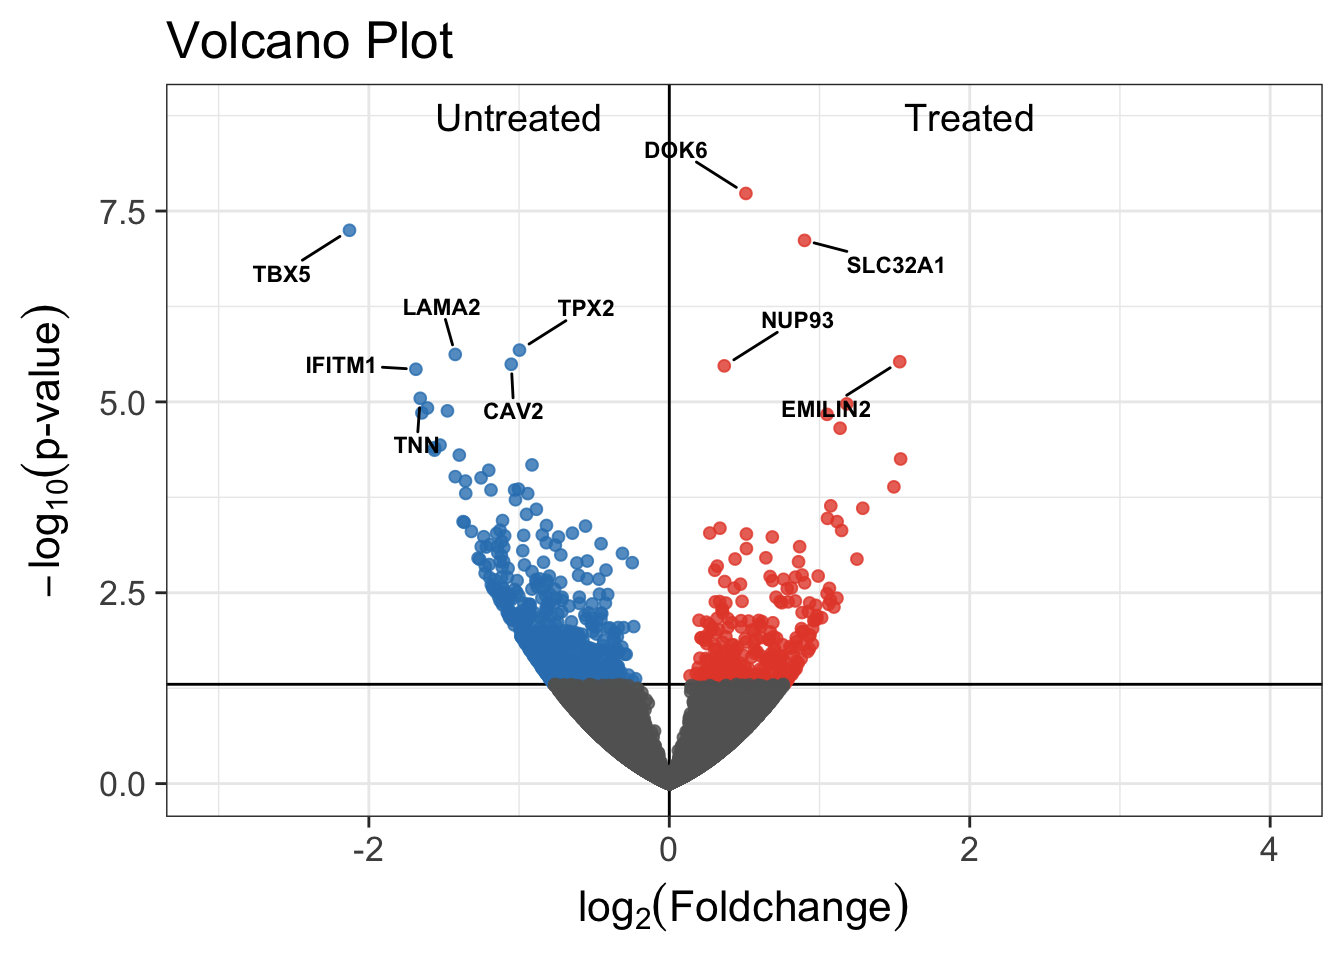
Volcano Plot annotated by Top10 most Significant Samples and transformed y-axis by log(1+x)
general.volcano_plot(iPSC, top_labeled=10, log1p=TRUE)
## Selecting by pvalue