Generate Data
library(BioViz)
library(reshape2)
library(ggplot2)
n=7
df <- data.frame(Dose1=exp((1/2)*1:n),
                 Dose2=exp((1/3)*1:n),
                 Dose3=exp((1/4)*1:n),
                 Dose4=exp((1/5)*1:n),
                 Dose5=exp((1/6)*1:n),
                 Dose6=exp((1/7)*1:n),
                 Visit=1:n)
df <- melt(df, id=c("Visit"))
colnames(df) <- c("Visit", "Dose", "Measure")
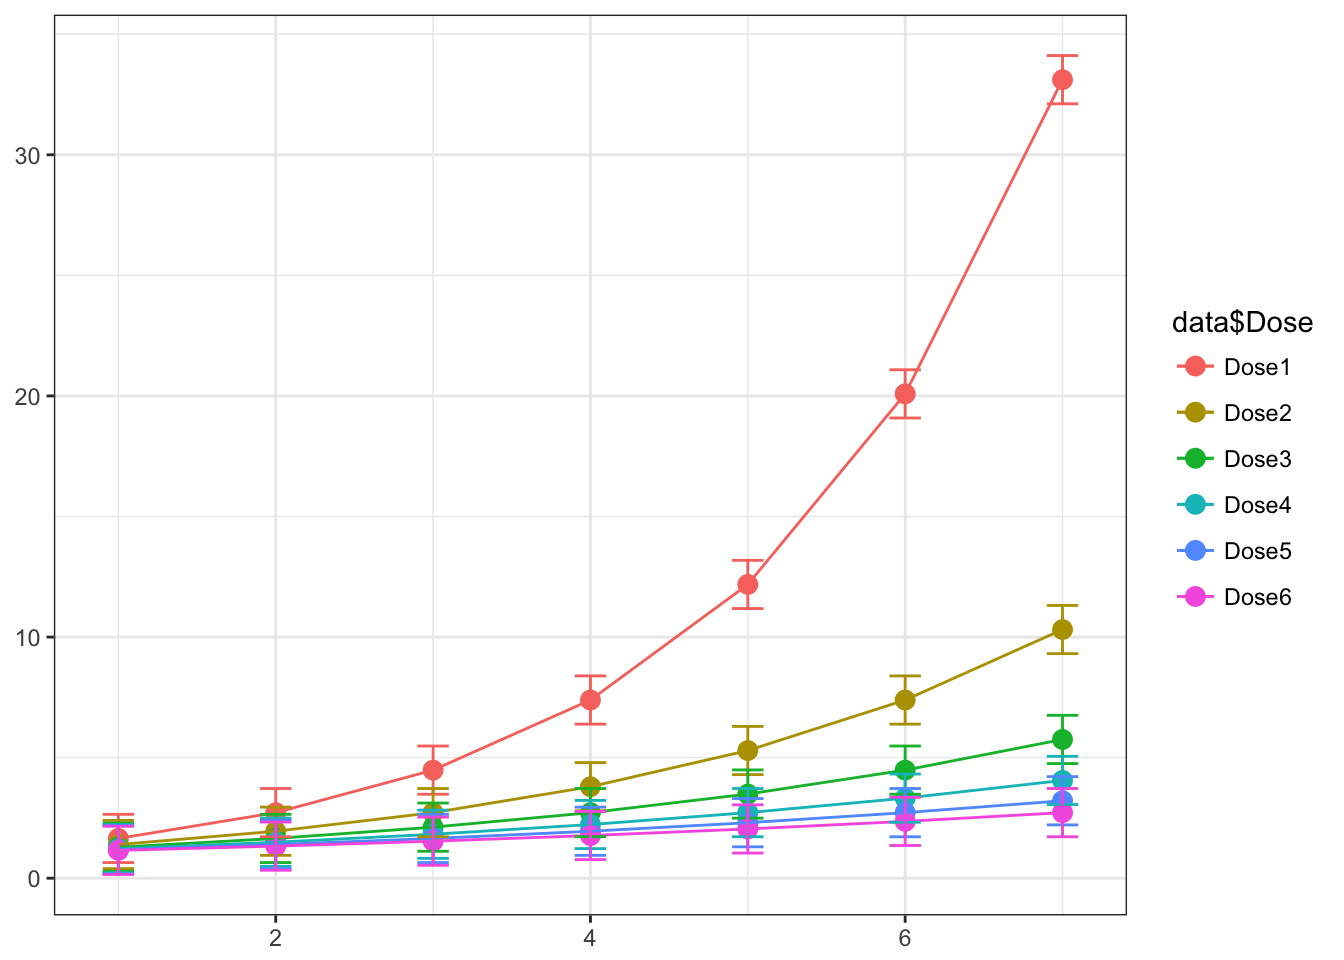
Lineplot with Errorbars
general.lineplot(df, upper.err=1, lower.err=1, var.type="errorbar")
## Warning: Ignoring unknown aesthetics: fill
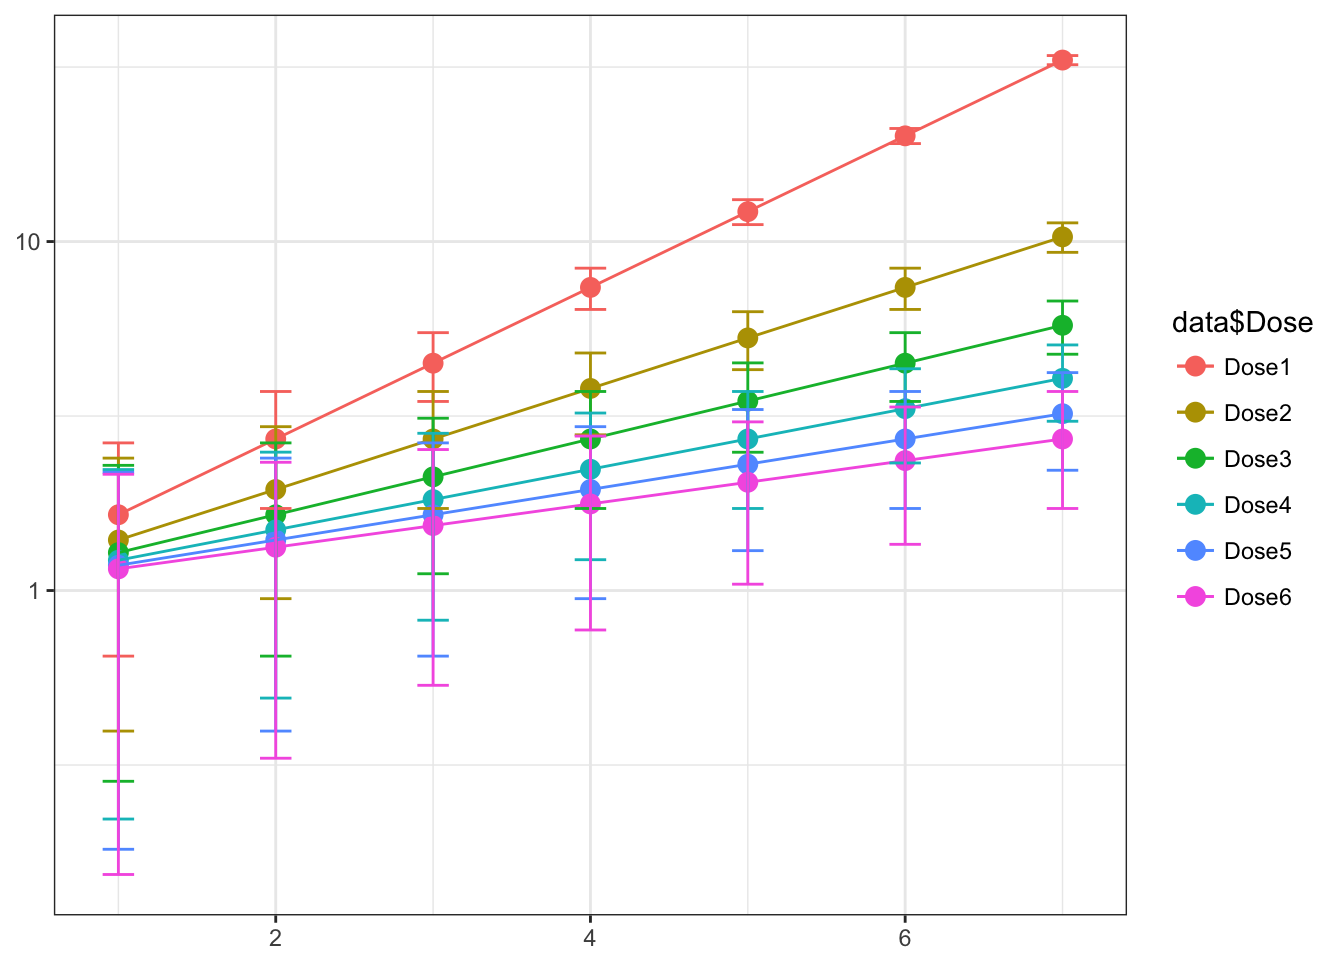
Facetted Lineplot
general.lineplot(df, by="Dose", facet.row=3, upper.err=1, lower.err=1,
                 var.type="errorbar", y.log10trans = T)
## Warning: Ignoring unknown aesthetics: fill
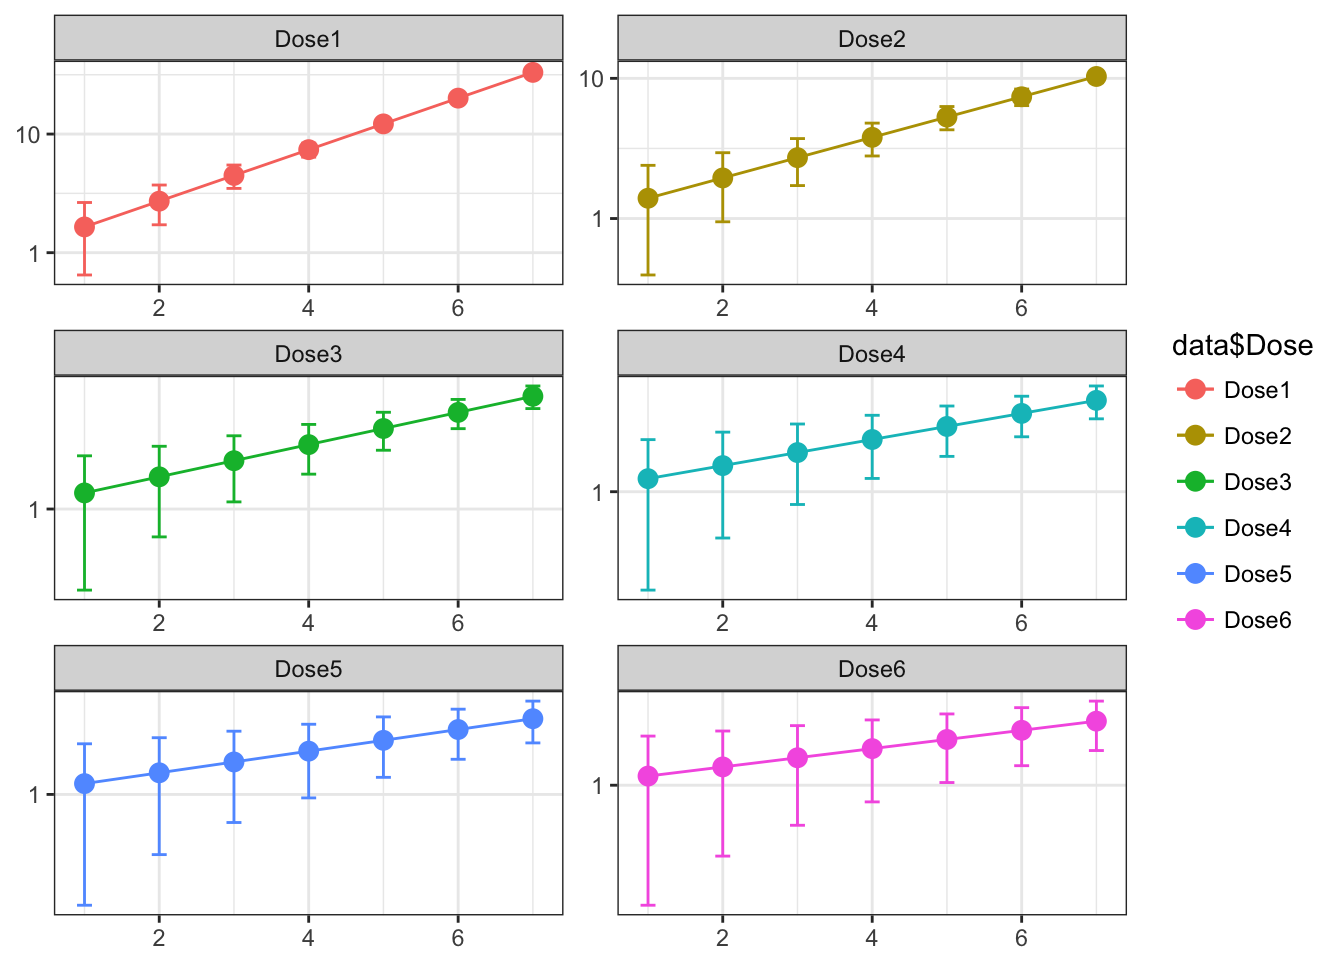
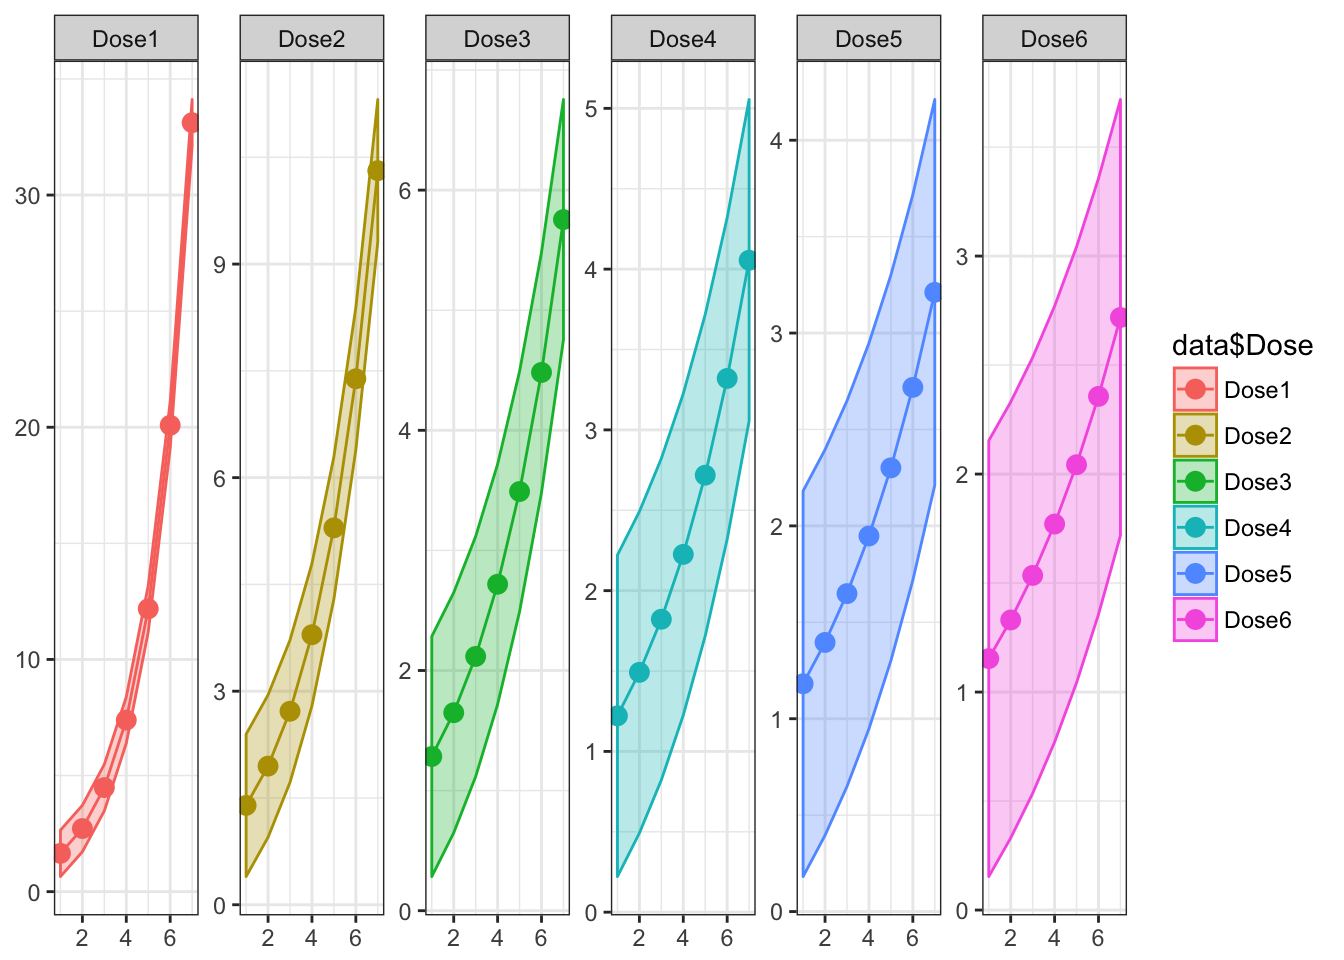
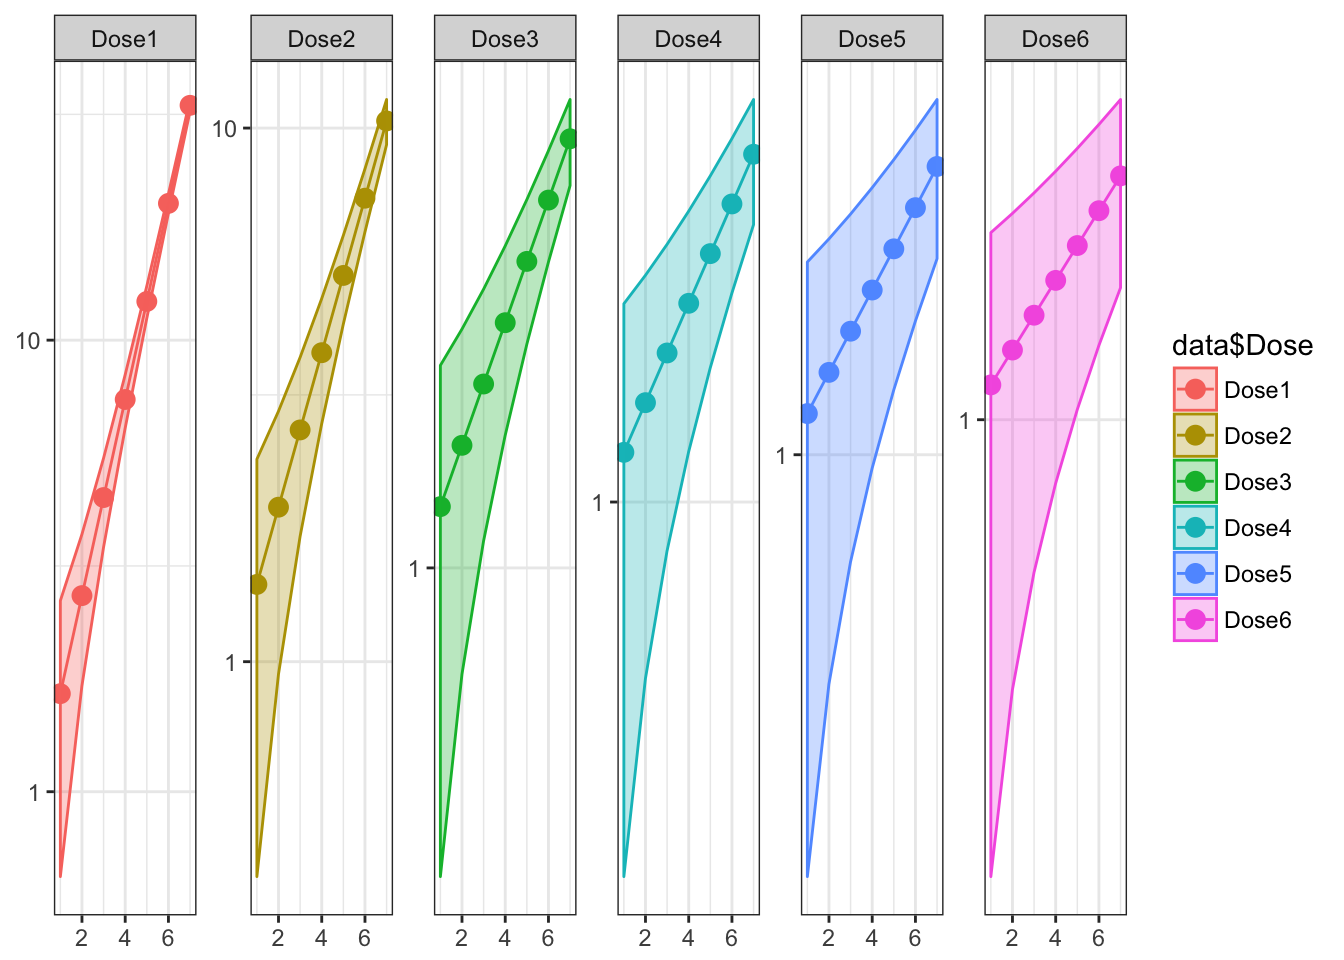
Lineplot with Error Ribbons
general.lineplot(df, by="Dose", upper.err=1, lower.err=1, var.type="ribbon")
## Warning: Ignoring unknown aesthetics: fill